Wilcoxon Signed-Rank Test – Excel and Google Sheets
Written by
Reviewed by
This tutorial will demonstrate how to perform the Wilcoxon Signed-Rank test in Excel and Google Sheets.
The Wilcoxon Signed-Rank test is a non-parametric test that uses a set of matched samples to compare the locations of two populations. It performs a similar function as the paired-sample Student’s t-test except that, unlike the matched sample T-test, it does not require the normality of the population.
The Wilcoxon Signed-Rank test can also be used to compare the location of a set of samples against a hypothesized median. This performs the same function as the one-sample Student’s t-test.
Similarities/Differences between Student’s T-Test and Wilcoxon Signed-Rank Test
- Both Student’s T-Test and Wilcoxon Signed-Rank Test are used to determine whether there is a statistically significant difference between TWO sets of data, either one sample against hypothesized value, dependent samples, or matched/paired samples.
- The Student’s T-Test assumes that the dataset is from a normally distributed population but the Wilcoxon Signed-Rank test does not make this assumption.
When to Use Wilcoxon Signed-Rank Test
The Wilcoxon Signed-Rank Test is used when any of the sets of data violates the normality condition.
Assumptions for Wilcoxon Signed-Rank Test
- The data being measured must be at the ordinal or continuous level. (i.e. the data must be a ranked scale or a number.)
- The independent variable’s data should be from a related group or matched pairs.
- The differences between the two related groups must be symmetrical.
How to Perform the Wilcoxon Signed-Rank Test in Excel
Wilcoxon Signed-Rank Test Table of Critical Values
In this method, we compare the Wilcoxon Signed-Rank test statistics with the critical value. Listed below is the step-by-step guide on how to perform the Wilcoxon Signed-Rank test using the method of critical values.
Example
Background: A researcher wants to find out whether the mode of delivery of a test has any effect on students’ test scores. He selected a random sample of 8 students and administered a similar test to them using print mode and computerized mode. The scores of each of the students in the two modes of the test are shown below. Test at a 5% significant level whether there is a significant difference in the scores of the students for the different modes of test delivery. The researcher is not sure whether the distributions of test scores for both test delivery modes are normally distributed.
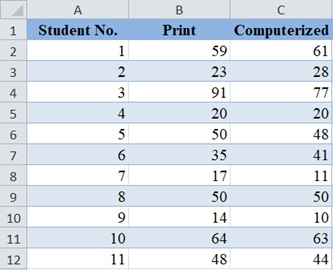
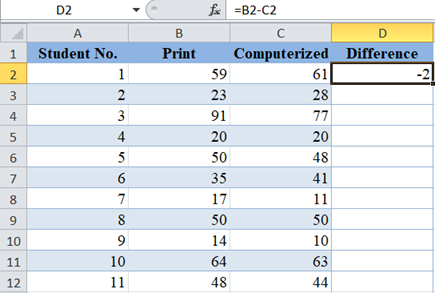
First, calculate the difference in the test scores of each of the students by subtracting the ‘Computerized’ scores from the ‘Print’ scores:
Complete the same for the rest of the students.
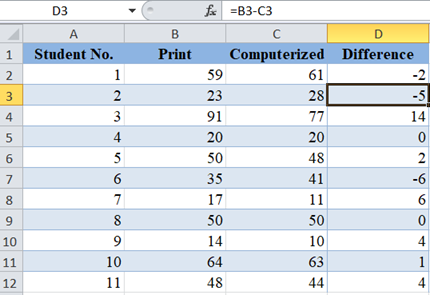
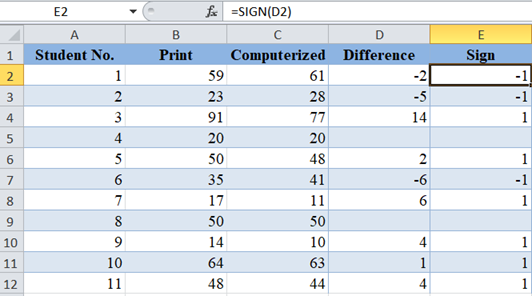
Next, remove the ‘0’ differences because they will not be needed in further calculations, then obtain the signs of the differences using the SIGN Function. The SIGN Function returns -1 for negative numbers and 1 for positive numbers.
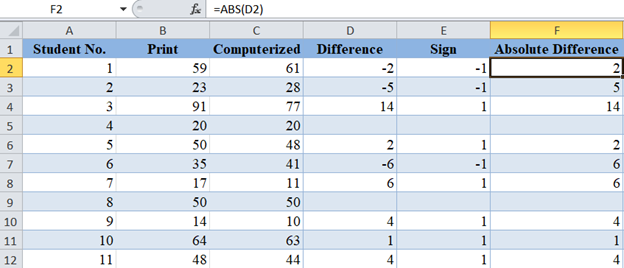
Next, obtain the absolute values of the differences using the ABS Function.
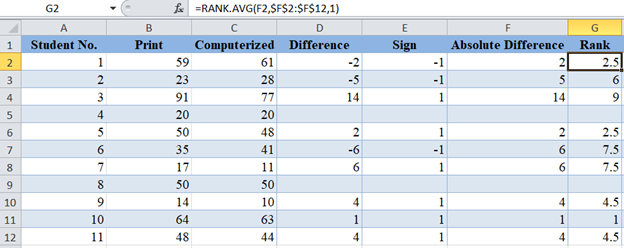
Next, obtain the ranks (in ascending order) of the absolute differences using the RANK.AVG Function.
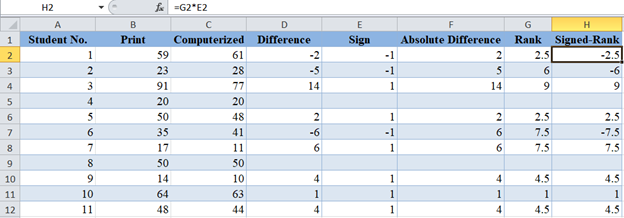
Next, multiply each rank with the corresponding sign in the Sign column to obtain the Signed-Ranks:
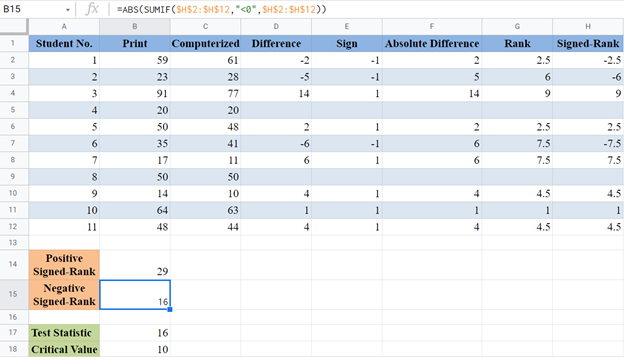
Now, we are going to use the SUMIF Function to obtain the sum of the positive Signed-Ranks:
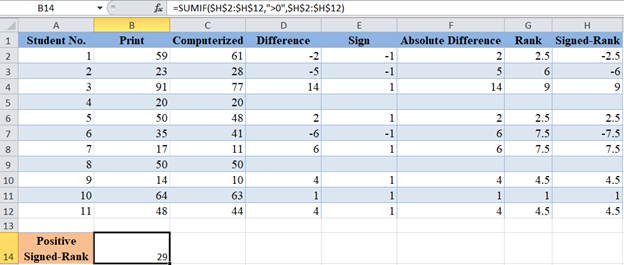
Use the ABS Function and the SUMIF Function to get the positive value of the sum of the negative Signed-Ranks:
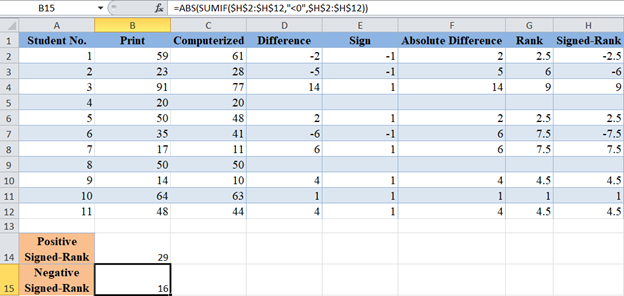
Notice that for the Positive Signed-Rank sum, the criteria in the SUMIF Function is “>0” while the criteria for the negative Signed-Rank sum is “<0”.
For the Wilcoxon Signed-Rank test, the test statistic is the smaller of the Positive Signed-Rank sum and the Negative Signed-Rank sum. For our case, the smaller is 16, so our test statistics is 16.
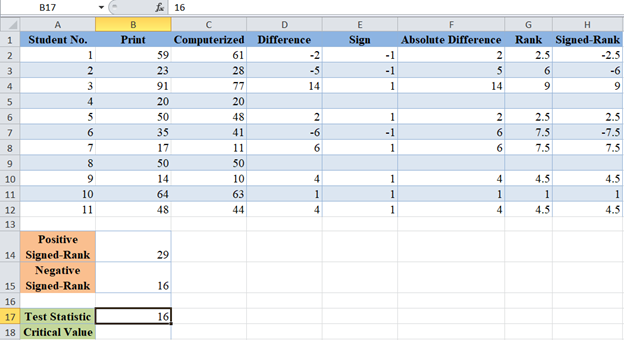
Now, obtain the critical value for the sample size of n= 11 and significance level of 5% from the Wilcoxon Signed-Rank table of critical values.
Note that we are doing a two-tailed test here because we are testing for the difference in values (and not increase or decrease in values) which is both ways both increase and decrease in values.
An excerpt of the Wilcoxon Signed-Rank table of critical values is shown below:
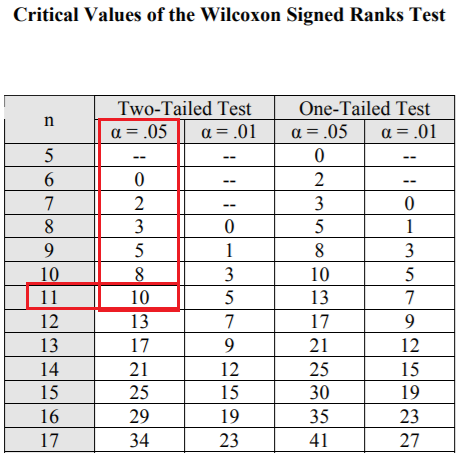
So, the critical value is 10.
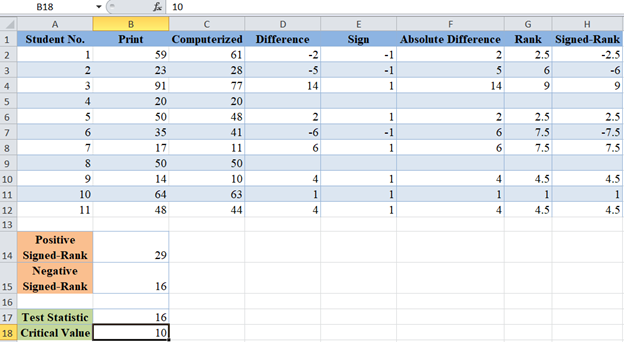
For the Wilcoxon Signed-Rank test, we conclude that there is a significant difference between the variables when the Test Statistics is less than the critical value.
Here, the test statistic is 16 and the critical value is 10, since the test statistic is greater than the critical value, we conclude that there is no statistically significant evidence that the mode of delivery of a test affects students’ test scores.
p-Value Method
Another method of performing the Wilcoxon Signed-Rank test is by approximating the distribution to a normal distribution and then use the p-value of the approximated z-score or t-score depending on the sample size.
In the following steps, we illustrate this method using the same example used in the previous method.
Background: A researcher wants to find out whether the mode of delivery of a test has any effect on students’ test scores. He selected a random sample of 8 students and administered a similar test to them using print mode and computerized mode. The scores of each of the students in the two modes of the test are shown below. Test at a 5% significant level whether there is a significant difference in the scores of the students for the different modes of test delivery. The researcher is not sure whether the distributions of test scores for both test delivery modes are normally distributed.
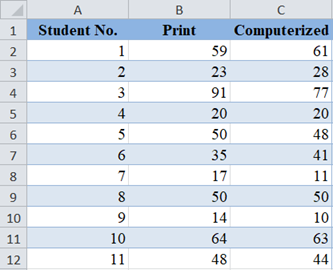
We are going to follow all the steps described in the previous method to obtain our test statistic (T). Remember that the test statistic is the smaller of the sum of the positive signed-ranks and the absolute value of the sum of the negative signed-ranks.
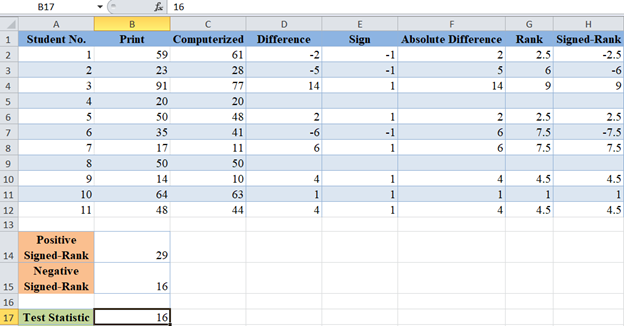
Now, we will obtain the mean and the standard error of the distribution. The mean ( μ) of the distribution is given by:

where n is the sample size, and the standard error is given by:
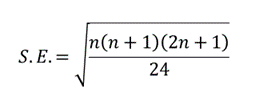
For our case, n=9 after removing the ‘0’ differences. So, we calculate the mean as follows:
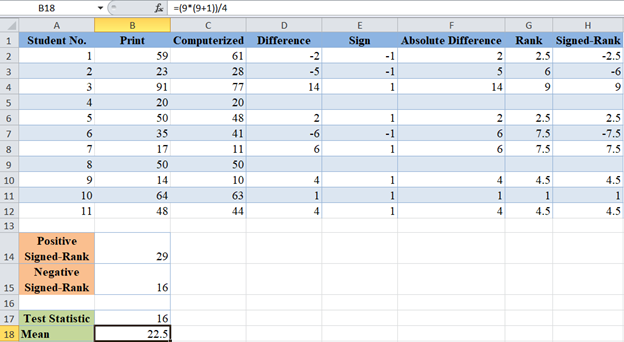
and the standard error as follows:
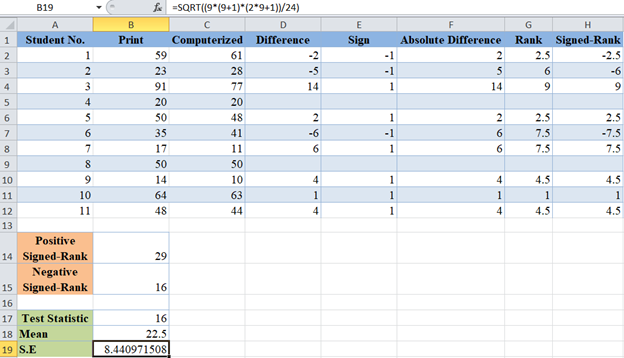
Next, calculate the t-score for the observations using the formula:

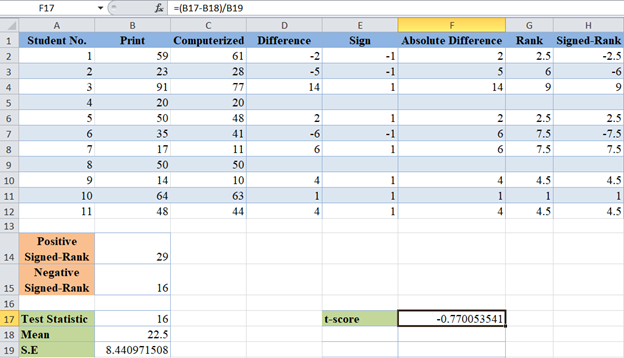
Finally, calculate the p-value for the observations using the T.DIST Function. For the T.DIST Function, x is the t-score, degree of freedom is n-1=9-1=8, and select ‘TRUE’ for cumulative distribution function. Also, since we are performing a two-tailed test, we multiply the result of the T.DIST Function by 2.
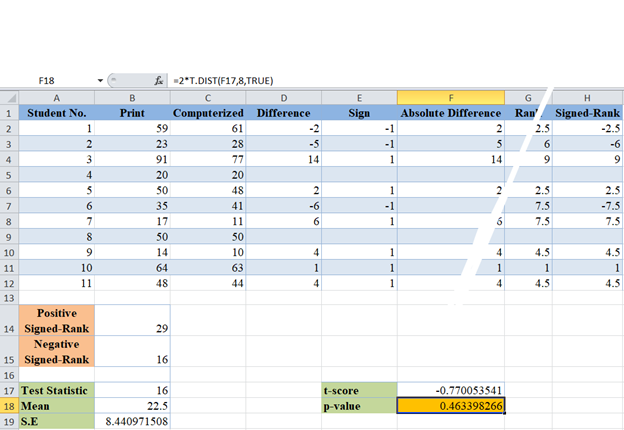
The p-value here is 0.463 which is greater than our significant level of 5% or 0.05. Therefore, ‘fail to reject the null hypothesis’ which means that we conclude that there is no statistically significant evidence that the mode of delivery of a test affects students’ test scores.
The Wilcoxon Signed-Rank Test in Google Sheets
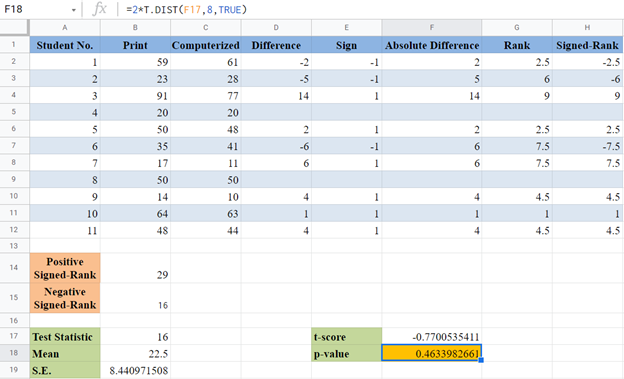
The Wilcoxon Signed-Rank test can be calculated in similar ways in Google Sheets as in Excel as shown below.
For the critical value method, we have:
and when using p-value we have:
