Use Different Types of Tables in Excel & Google Sheets
Written by
Reviewed by
This tutorial describes different types of tables in Excel and Google Sheets.
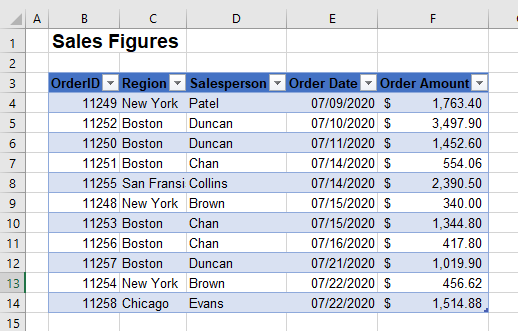
Generally, when referring to “an Excel table,” a user is talking about the Excel-specific table feature (see How to Create an Excel Table). But “table” in Excel can mean different things. It might be raw data with fields in rows, or it could be any of the types below.
Ranged Tables
You can create a table from a range of cells in Excel and similarly, you can convert a table into a simple range of cells.
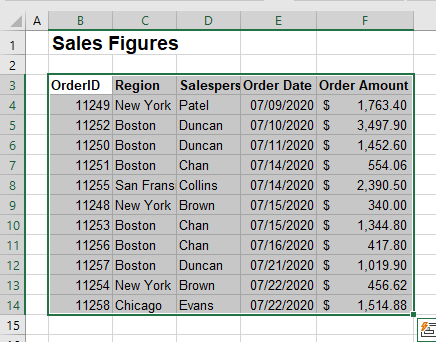
- To create a table from a range, highlight the range of cells with your data.
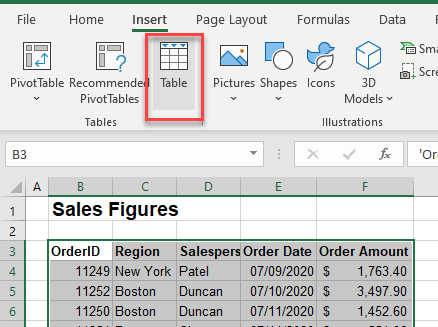
- In the Ribbon, go to Insert > Tables > Table.
- Your data is now converted to a table and formatted with a default style.
- You can use the filter buttons at the top of each column to filter your data, as well as use the Table Design tab on the Ribbon to format and adjust the way the table is displayed.

Convert to Range
To convert your data back to a range, in the Ribbon, go to Table Design > Tools > Convert to Range.
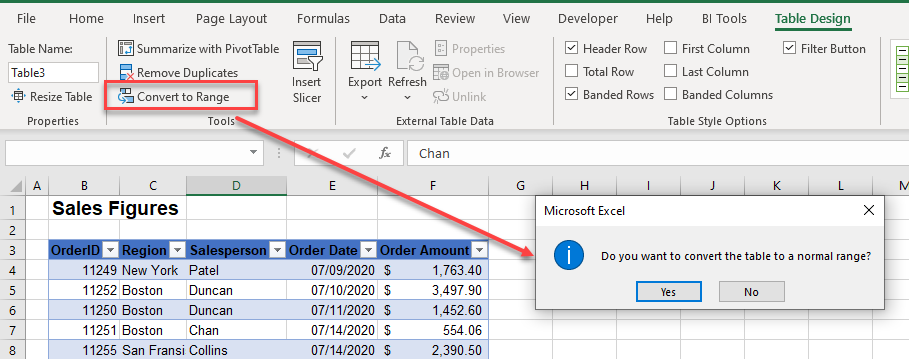
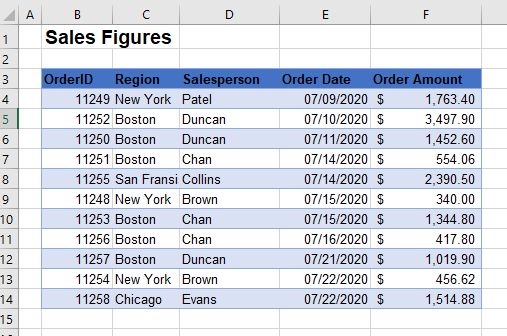
This keeps the formatting for your table but removes the ability to filter on each column and the Table Design tab is no longer displayed.
Dynamic Tables
A dynamic table is a table created from an original table and inserted into your data by using the name of the table in your formula.
For example, say you have the table below:
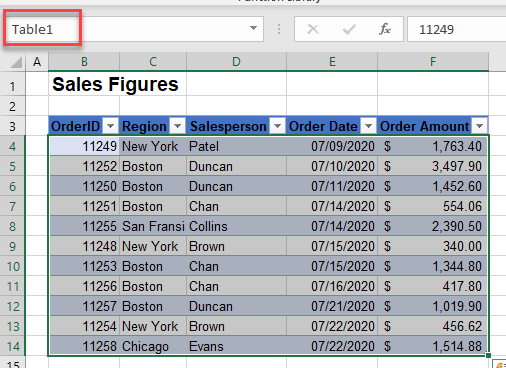
- Look at the name box; the name of the table is Table1.
- Click in a separate part of your worksheet, and type the following formula:
=Table1
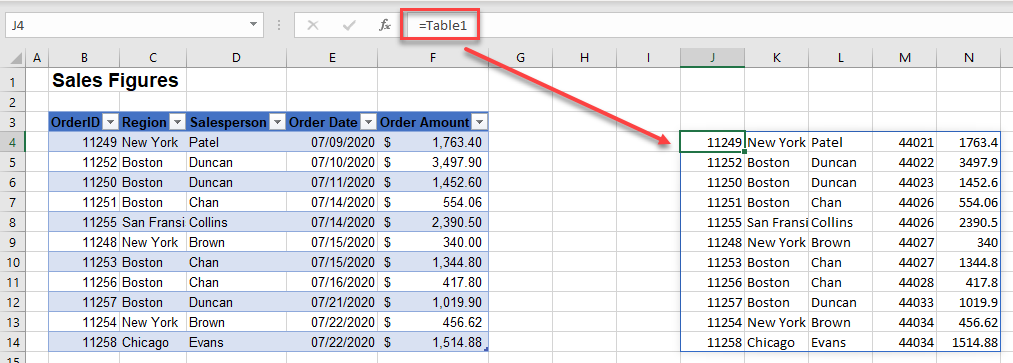
The data from the table is now placed in your worksheet at your selected location. Only the data is placed, not the column headers. It will change whenever the original table is changed.
HTML Tables
An HMTL table is a table that has data that has been imported from the internet.
- In the Ribbon, go to Data > Get & Transform Data > From Web.
- Type in the URL where the data is stored on the web.
- Then, Transform Data to bring your HTML table into Excel.
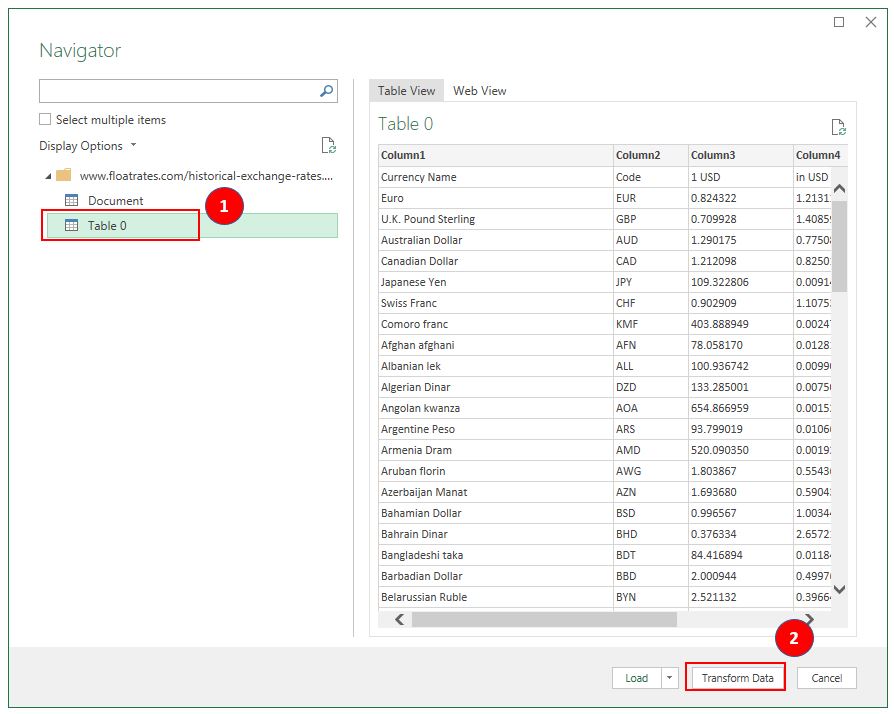
You can embed a table you created in Excel into an HTML table by saving your Excel file as an HTML file.
Pivot Tables
A pivot table is a table that is a summary table of information that comes originally from a bigger table.
- Click in your original table, and then, in the Ribbon, go to Insert > Pivot Table.
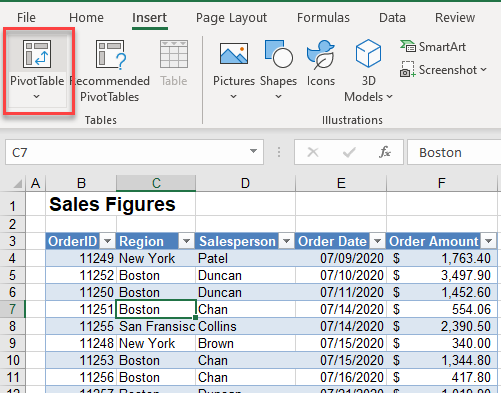
- Choose whether to create the pivot table in a new sheet, and you are then able to add the fields and values to your new pivot table.
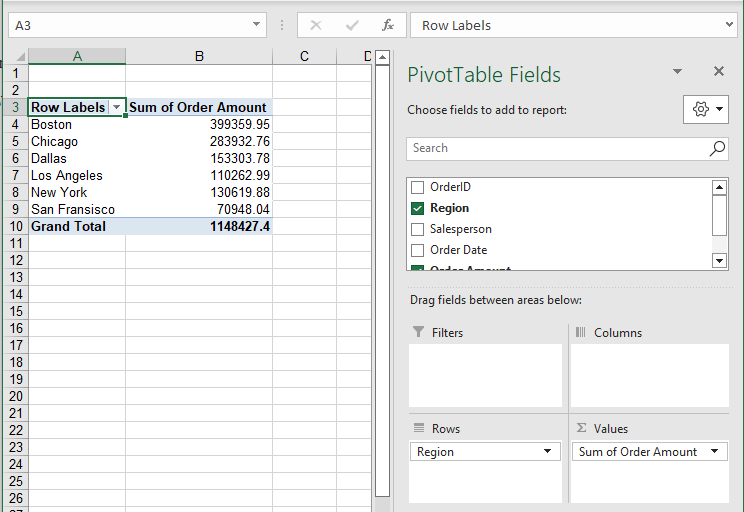
Pivot tables have a robust range of features and are very customizable. Try using some shortcuts when you’re working with pivot tables.
Types of Tables in Google Sheets
Google Sheets does not have anything equivalent to Excel tables. You can, however, use pivot tables and HTML tables.
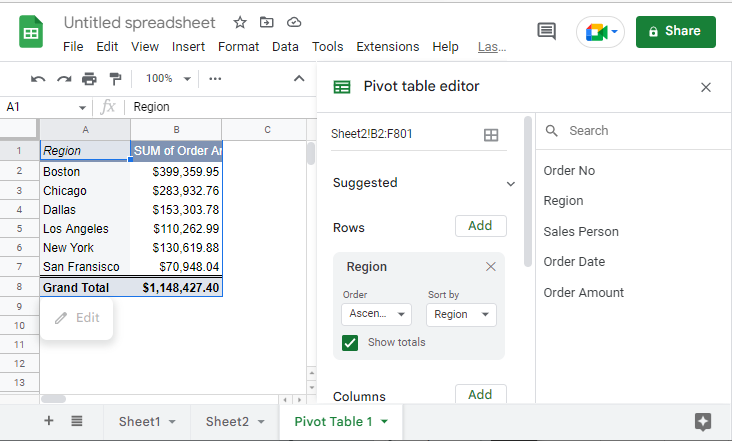
- Click within the data you want to create the pivot table from, and then, in the Menu, go to Insert > Pivot table.
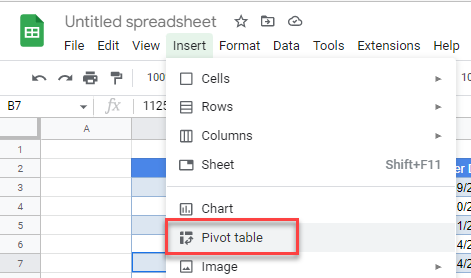
- Insert the pivot table into a new sheet and then add the row, column, and value fields as needed.
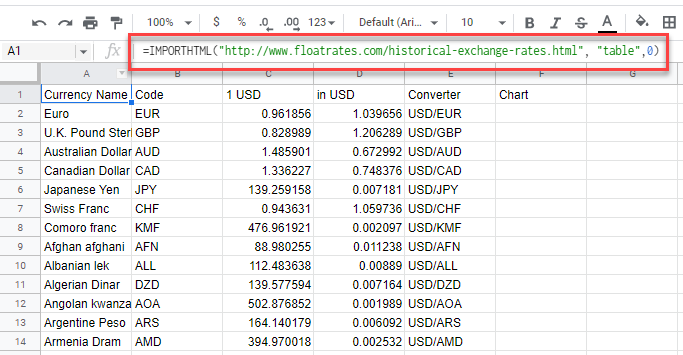
To insert an HTML table, you can type the URL you wish to get the data from in the formula bar in your sheet.
