How to Create an Excel Table
Written by
Reviewed by
This tutorial demonstrates how to create a table in Excel.
Create Table Shortcut
T for Table
Read more about creating tables below.
In this Article
An Excel table is a range of data that is organized into logical rows and columns with each column having a name to describe that data that is stored in the cells of the rows beneath it. There are a number of different table types in Excel such as ranged tables, dynamic tables, HTML tables, and pivot tables.
Create an Excel Table
You can create an Excel table from existing data, or you can create a blank table and fill it with data afterward.
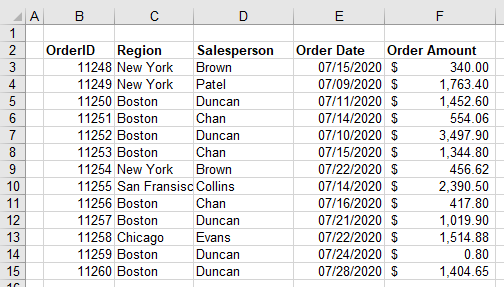
- First, ensure your data is laid out in a way that is compatible with creating a table, e.g., each column should have a header row that describes the contents of that column and no blank rows or columns should exist in the middle or the data.
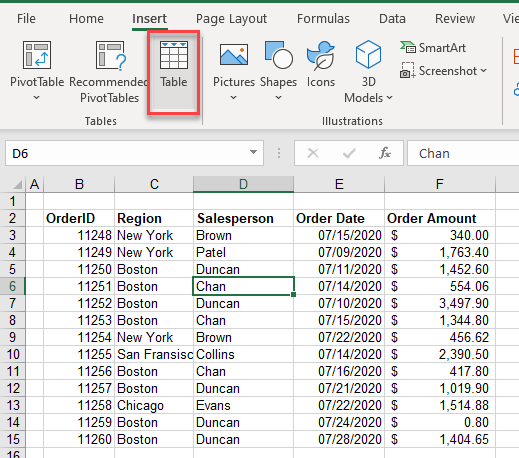
- Then, in the Ribbon, go to Insert > Table.
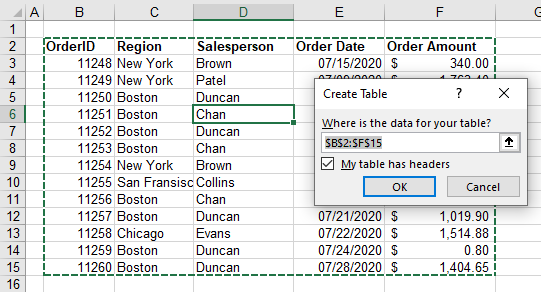
- Excel selects the entire range of data. Leave My table has headers checked, and then click OK.
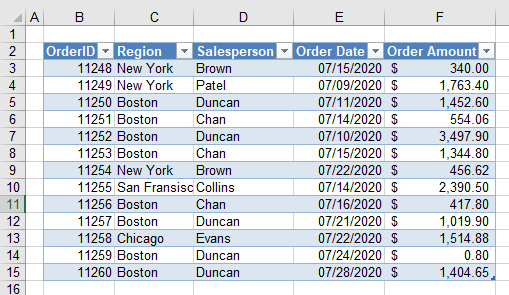
- This automatically creates a table as far down as the next blank row and as far across as the next blank column.
Alternate Shading in a Table
When a table is automatically created, the table is formatted according to the default table style that exists in Excel. This means that the top row is formatted with a blue background and white writing, while the rows below are formatted with alternating blue and white backgrounds.
- To change the table’s appearance, click somewhere within the table and in the Ribbon, go to Table Design > Table Styles. Choose a style.
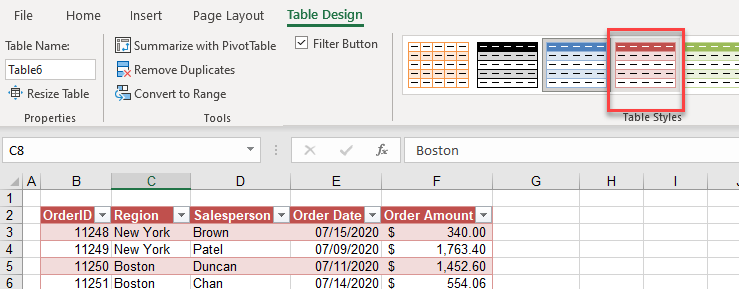
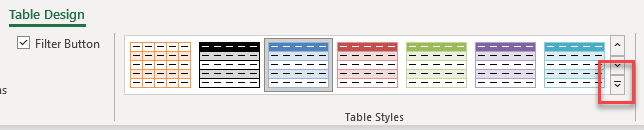
- The format changes according to the style you choose. There are many built-in styles available. To access a few more styles, click the “more” button as shown below.
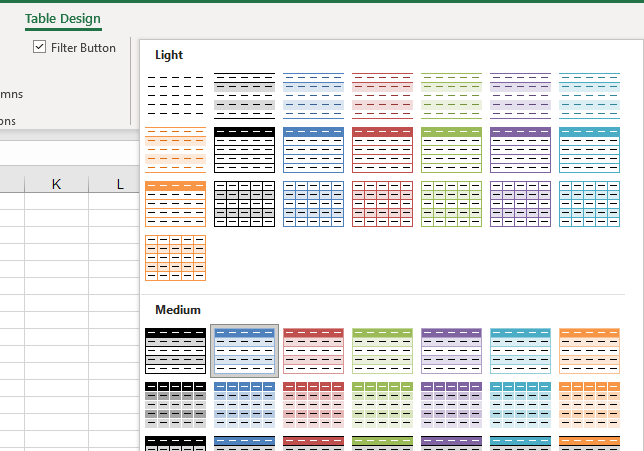
- The list of styles is expanded to show a variety of different table styles. Choose one.
Convert Table Back to a Range
If you have formatted your data as a table, and then wish to remove the filter options and convert your table back to a range, use the Table Design tab.
- Click in your table, and then in the Ribbon, go to Table Design > Tools > Convert to Range.
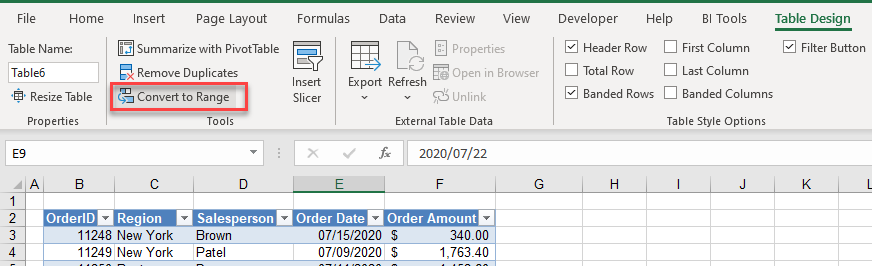
- Click OK to convert your table to a range.
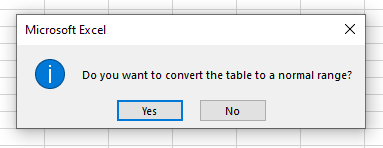
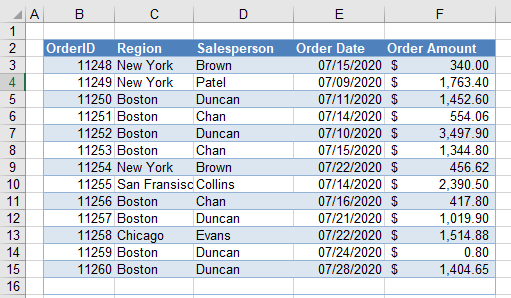
While the formatting is preserved, the filters are removed from the column headers indicating that the data is now a normal range and no longer a table.
Link Tables: Relationships
If you have data in two different ranges in Excel, but the data is linked together by a common column name, you can create a relationship between these two sets of data if both sets of data are Excel-formatted tables.
Consider the following two tables in Excel.
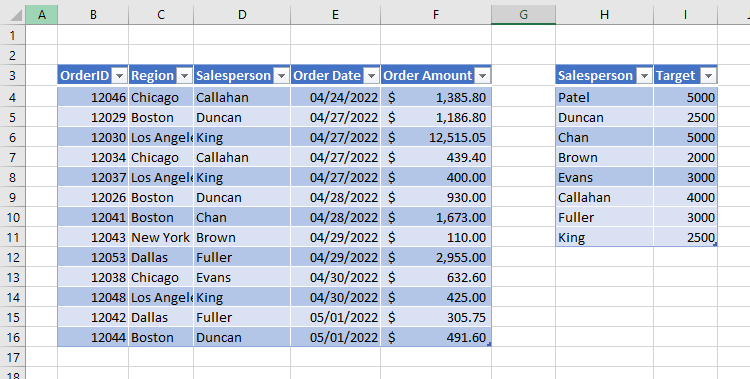
One table contains the salesperson‘s name and their sales target, while the other table contains their order amounts. In one table, the salesperson appears only once while in the other table the salesperson can appear multiple times.
Note: the data does not have to be on one sheet and may be much larger than the example above.
For example, you can link two tables together by creating a relationship between them and then create a pivot table that combines information from both tables.
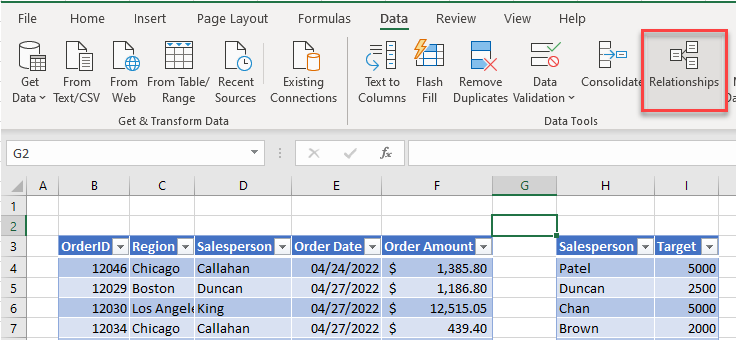
- In the Ribbon, go to Data > Data Tools > Relationships.
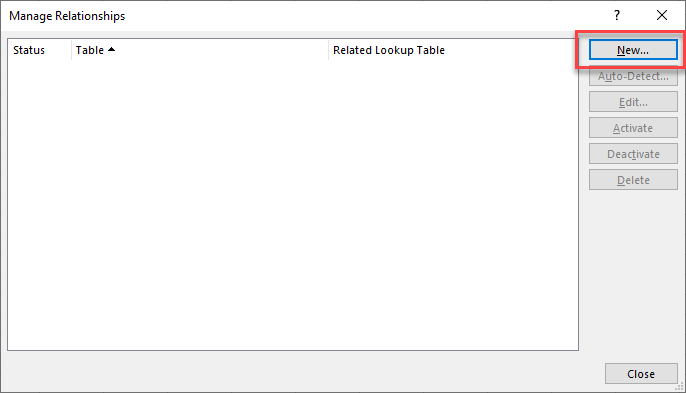
- In the Relationships window, click New.
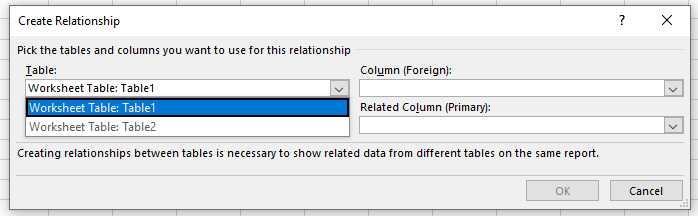
- In the Table drop down, choose the first table. In the drop down below, choose the second table.
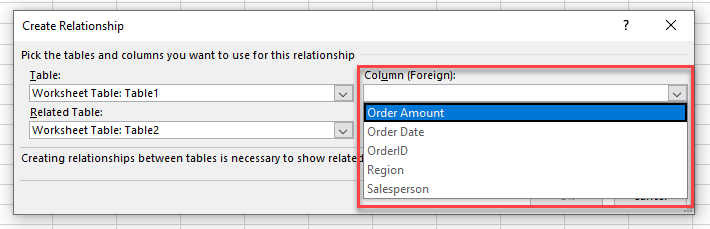
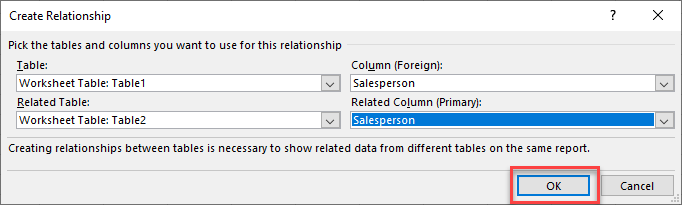
- In the Column table, first choose the Foreign column (in this case, Salesperson as it can appear multiple times); and then in the Related Column, choose the same field from the second table.
This becomes the Primary column; salesperson can appear only once in a table based on the new relationship.
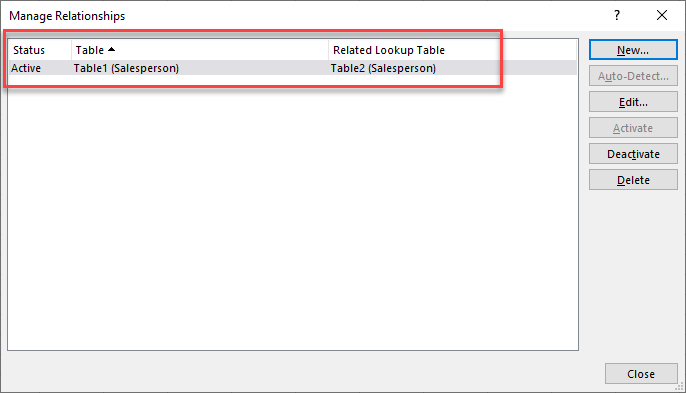
- Click OK to create the relationship.
- Click Close to return to Excel.
Benefits of Using a Table
Automatic Totals
Adding a total row to a table is incredibly easy.
▸ Click in your table, and then, in the Ribbon, go to Table Design > Table Style Options > Total Row.
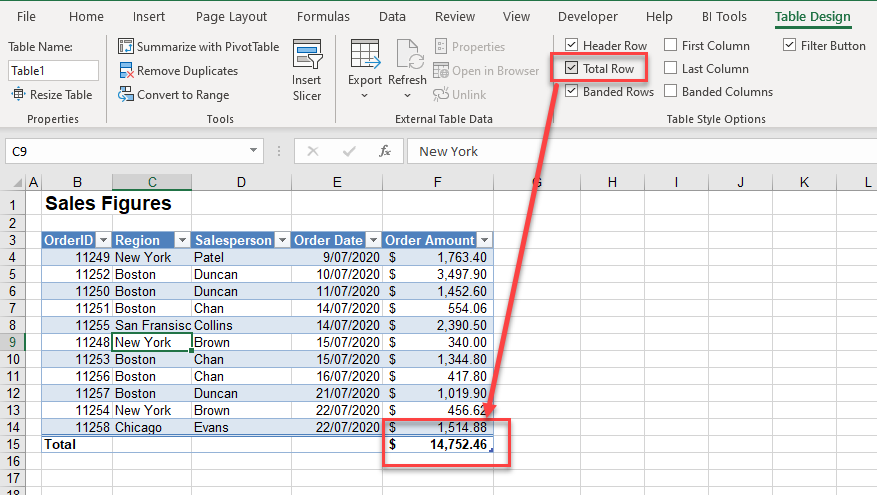
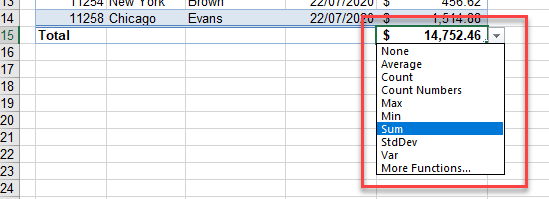
The default function used for the Total Row is the SUM Function. You can, however, use a different function.
Notice that the Header Row, Banded Rows, and Filter Button are also ticked in this group of options.
- If you switch off the Header Row, then the Filter Button option is no longer available.
- If you switch off the Filter Button option, you won’t see filter arrows in your table.
- If you switch off the Banded Rows option, the rows are no longer shaded with alternating colors.
Add Rows With Tab Key
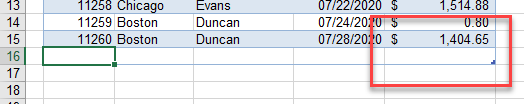
One of the benefits of using at table is that it expands automatically when you enter more data. Notice that in the bottom row of the table, a small, backward-L-shaped handle exists.
![]()
If you click in this cell and press the TAB key, a new row in the table is created, and your cursor is moved to the first cell in the new row. The table has therefore automatically expanded to include this row.
This is useful since some of the benefits of using a table are the sorting and filtering options that are built into the table. If you then wanted to filter on the Salesperson, for example, the new record is automatically included in that filter. Similarly, if you sort the data, the new row(s) are included in the sort.
Consistent Formulas
If you add two more columns to the table, these would automatically be included in the table, as the new rows were above.
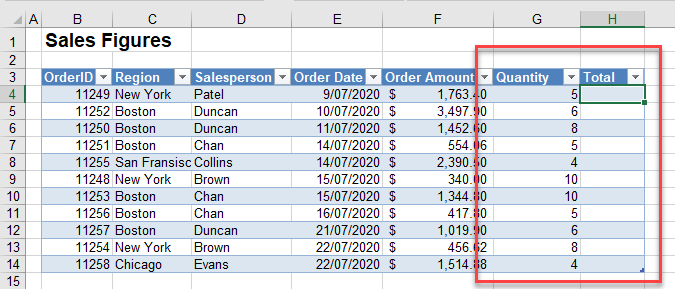
Then, add a formula to work out the total by multiplying the Order Amount by the Quantity. The formula is created using the field names (column headers).
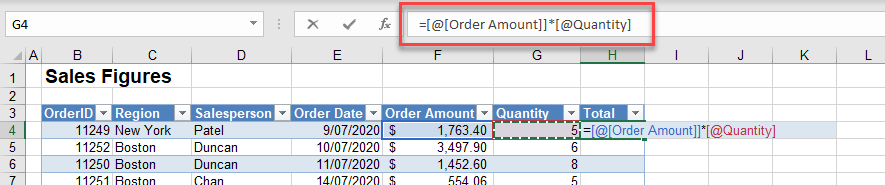
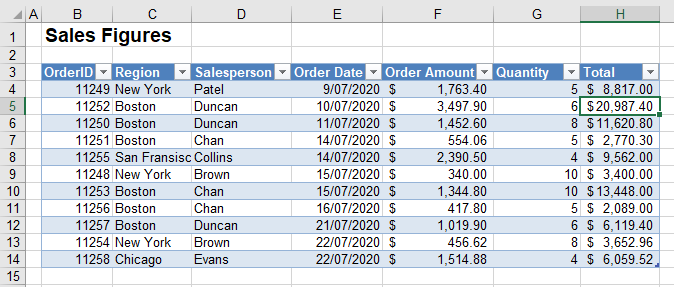
When you press ENTER, the formula is copied down to all the other rows in the table.
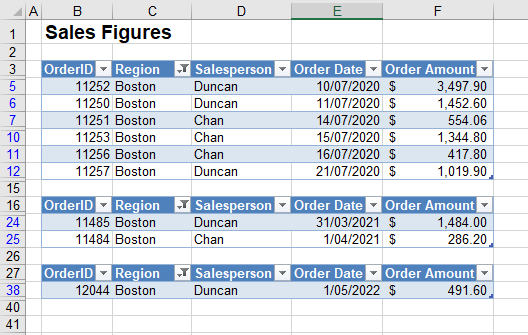
Multiple Filters on One Sheet
In the example below, a table has been created for each year of orders, and then, each table has been filtered by region to show the orders for a single region in each individual year.
Combine Tables Into One Pivot Table
If you have created a relationship between two tables using a common field such as Salesperson, you can create a pivot table using fields from both tables.
Tip: Try using some shortcuts when you’re working with pivot tables.
- In the Ribbon, go to Insert > Pivot Table > From Data Model.
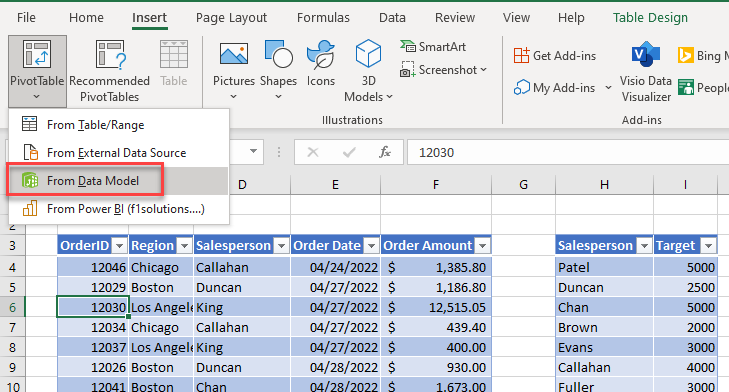
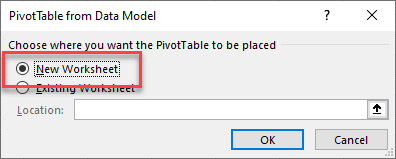
- Choose New Worksheet, and then click OK.
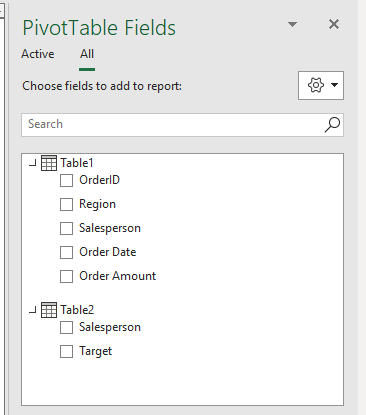
- You now have the common field available in both your tables (Salesperson). As these fields are the link between the two tables, you can use either one in your pivot table; both return the same values.
Able to Use Slicers
When your data is formatted as a table, you are able to use slicers to filter your data.
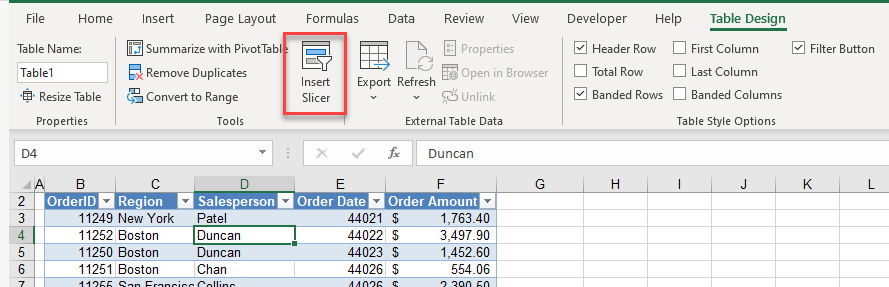
- Click in your table and then, in the Ribbon, go to Table Design > Tools > Insert Slicer.
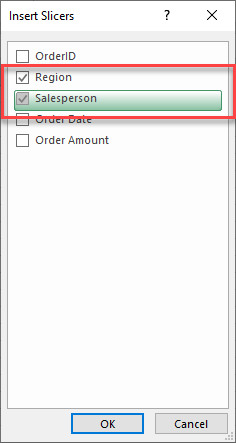
- Choose the field or fields of the slicer you wish to insert, and then click OK.
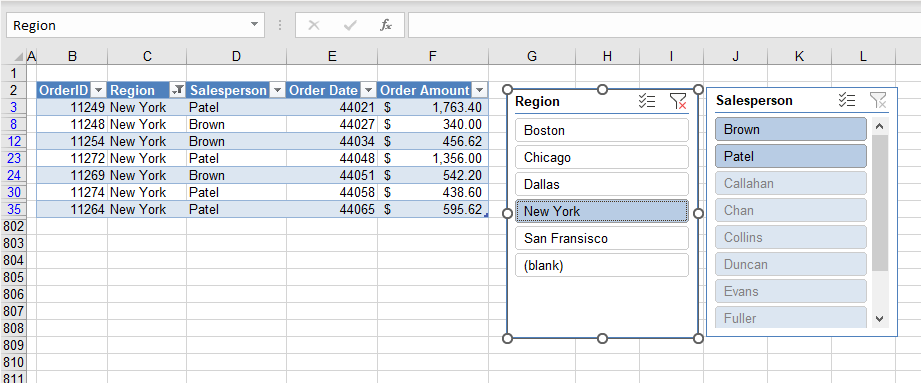
- Filter your data by clicking an individual value in the slicer, or you can hold down the CTRL key (for nonconsecutive values) or the SHIFT key (for consecutive values) to filter on multiple values.
PowerPivot and Power Query
Any data used in a Power Pivot or Power Query must be in a table format. So for users of Power Query, formatting as an Excel table is a necessity, not just a benefit.
More on Tables
| Tables | |
|---|---|
| Add a Column and Extend a Table | |
| Add a Total or Subtotal Row to a Table | |
| Compare Two Tables | |
| Convert a Table to a Normal Range | |
| Display Data With Banded Rows | |
| Remove a Table or Table Formatting | |
| Rename a Table | |
| Rotate Data Tables | |
| Conditional Formatting | yes |
| Highlight Every Other Line In Excel | |
| Copy & Paste | yes |
| Copy Every Other Row | |
| Database | yes |
| Create a Searchable Database | |
| Filters | yes |
| Filter Rows | |
| Find & Select | yes |
| Select Every Other Row | |
| Format Cells | yes |
| Alternate Row Color | |
| Insert & Delete | yes |
| Delete Every Other Row |
