FREQUENCY Function in Excel, VBA, & Google Sheets
Written by
Reviewed by
Download the example workbook
This tutorial demonstrates how to use the FREQUENCY Function in Excel to create a histogram.
What is Frequency?
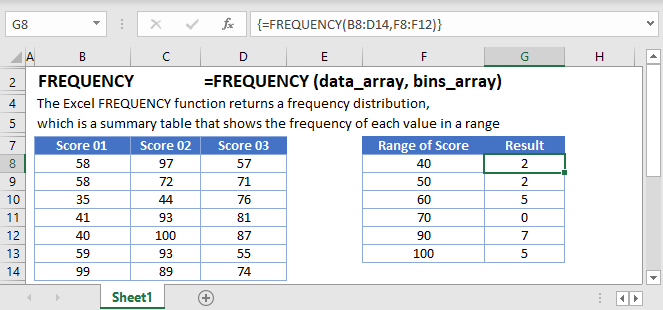
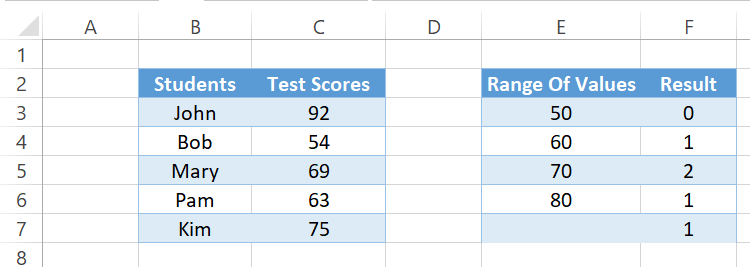
In statistical analysis, frequency is the number of times a data value occurs. For example, 8 students may score 65 on a test. Score of 65 would have a frequency of 8. In Excel, the frequency function calculates the number of values that fall within a range. Instead of just 65, you can calculate how many students score between 61 and 70.
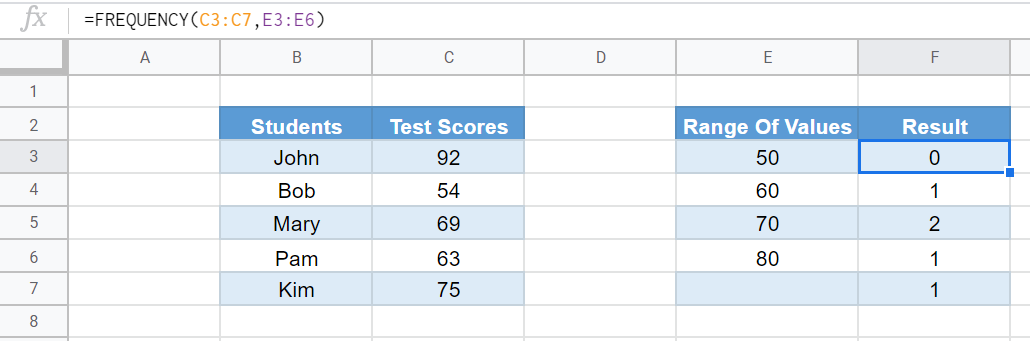
Let’s take a look at an example of student test scores. There are 2 students who scored between 61 and 70 (Mary and Pam)
{=FREQUENCY(C3:C7,E3:E6)}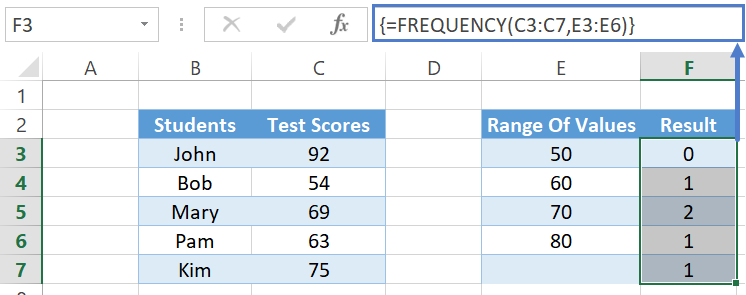
How to use the FREQUENCY Function
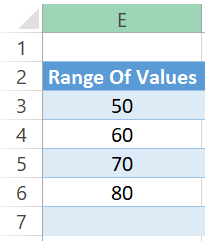
To use Excel FREQUENCY function, set up the range of values you wish to find first:
The range values simply means:
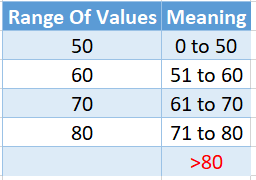
Notice two things above. The first range value will start from 0 and the maximum is the value indicated on the left.
There is an extra value I marked in red as well (>80). When it finds a value over your indicated range, it falls into this category.
Once that is done, you need to select a range with the size of your Range of Values (+ one additional row). In our example here, we have four Range of Values (50, 60, 70, and 80). So we select five (4 + 1 additional row).
Enter the Test Scores range and the Range of Values into the function:
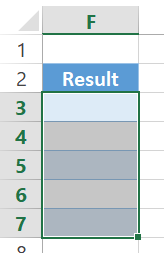
=FREQUENCY(C3:C7,E3:E6)Don’t press Enter, but CTRL + SHIFT + ENTER because this is an array formula. You should see curly brackets surrounding it when done right. If you’re using Excel 2019 or Office 365, you can enter the formula normally and even select just one cell to do the formula. It will spill down the range automatically.
![]()
This tells you 0 students scored Test Scores of 0 to 50. 1 student from 51 to 60 (Bob). 2 students from 61 to 70 (Mary and Pam). 1 student from 71 to 80 (Kim). And lastly, 1 student over your indicated range, >80 (John).
Empty Cells or Cells With Text
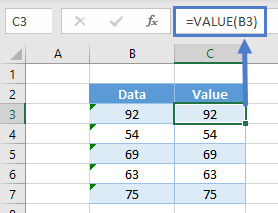
The FREQUENCY function ignores cells that are empty or that contain non-numerical values.
Important: The FREQUENCY function will ignore numbers stored as text. To use the FREQUENCY function with numbers stored as text, first, use the VALUE Function to convert the numbers stored as text to actual numbers.
FREQUENCY For Distinct Count With Condition
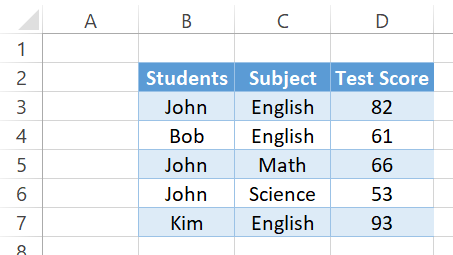
A very common usage for FREQUENCY function is to obtain a distinct count. For example, there are five Test Scores here, but just for 3 Students (John appeared thrice, while Bob and Kim appeared once).
Because the FREQUENCY function doesn’t deal with text, we have to convert the students into numbers. These numbers must also identify if they are the same students. Excel has a MATCH function that determines the first position number of what you’re looking for inside a range.
=MATCH(B3:B7,B3:B7,0)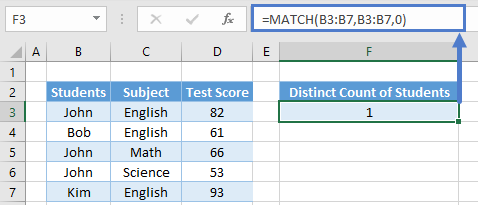
This means you’re looking for B3:B7 inside the range of B3:B7. This is an array formula and actually returns multiple results you are unable to see. If you click inside the formula bar and press F9 to calculate, you will see it shows:
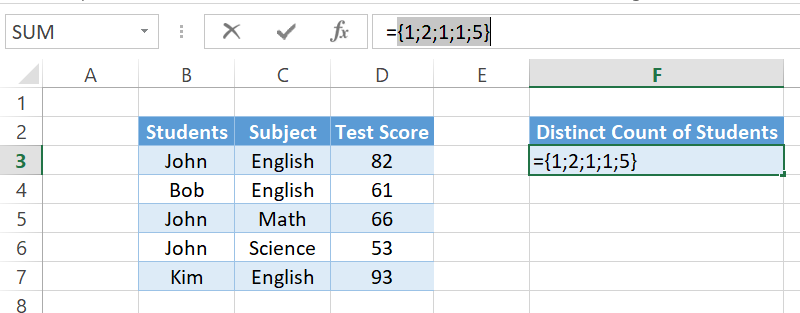
That means “John” is in position 1 (of B3:B7), “Bob” in position 2 (of B3:B7), “John” in position 1 (it returns the first position number), “John” in position 1 again, and “Kim” in position 5.
We need to create a Range of Values as well like our Test Score example. In here, we want to count how many are position 0 to 1 (John), >1 to 2 (Bob), and >4 to 5 (Kim). ROW function in Excel helps us retrieve the row number.
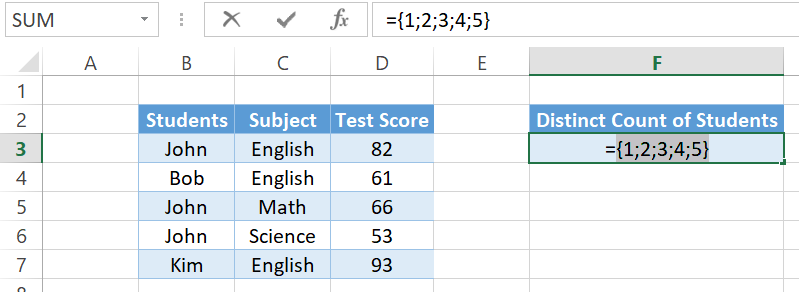
=ROW(B3:B7)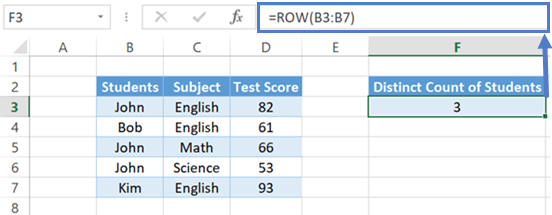
This gives us an array formula again. ROW(B3) gives us row 3, ROW(B4) gives us 4, and so on. You can click inside the formula bar and press F9 again to calculate again. It shows:
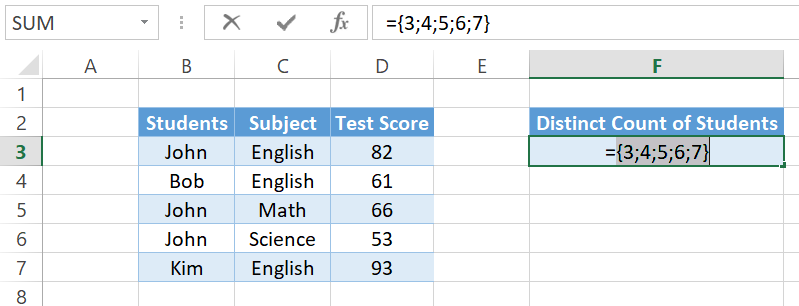
We want B3 to be row 1 and not row 3 though so that they are the same. To do that, simply deduct the starting row and plus 1.
=ROW(B3:B7)-ROW(B3)+1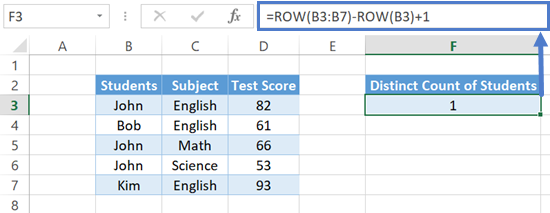
Row 3 minus 3 plus 1 is equals to 1. Row 4 minus 3 plus 1 is equals to 2. And so on. Click inside the formula bar and press F9 to check.
So instead of using the Test Score as the first argument and the Range of Values as the second argument of FREQUENCY, we can use the MATCH function and the ROW function to do the same.
=FREQUENCY(MATCH(B3:B7,B3:B7,0),ROW(B3:B7)-ROW(B3)+1)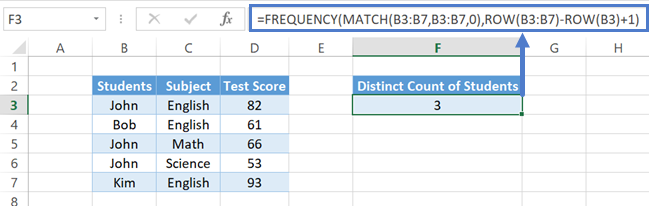
Press F9 to calculate and it shows:
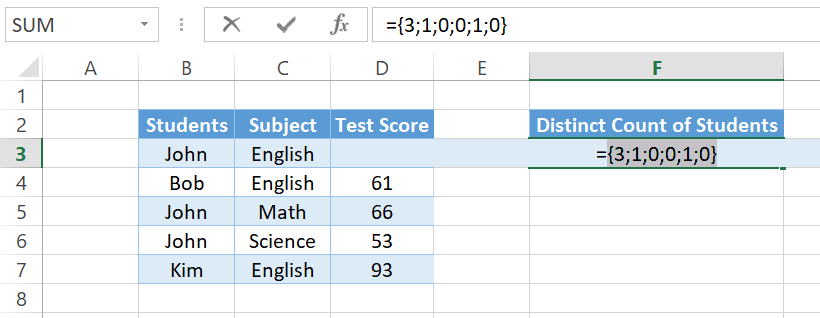
This means position 0 to 1 appeared 3 times (John), position >1 to 2 appeared once (Bob), position >2 to 3 and >3 to 4 appeared 0 times, and position >4 to 5 appeared once (Kim). And lastly, remember FREQUENCY has an additional Range of Values for those >5 (above your indicated range).
We could see how many times each of the students appeared now, but that’s not the goal. We want to know how many distinct students are there. And we could see from above that as long as the value is >0, there is a student in that position. Hence, we want to sum up any numbers in the array that is >0. Let’s first add the IF function to check if the FREQUENCY number is greater than zero. If it is, show as 1.
=IF(FREQUENCY(MATCH(B3:B7,B3:B7,0),ROW(B3:B7)-ROW(B3)+1)>0,1)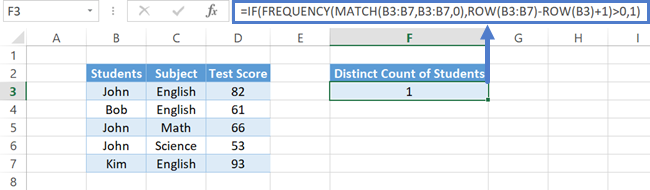
Press F9 to calculate and it shows:
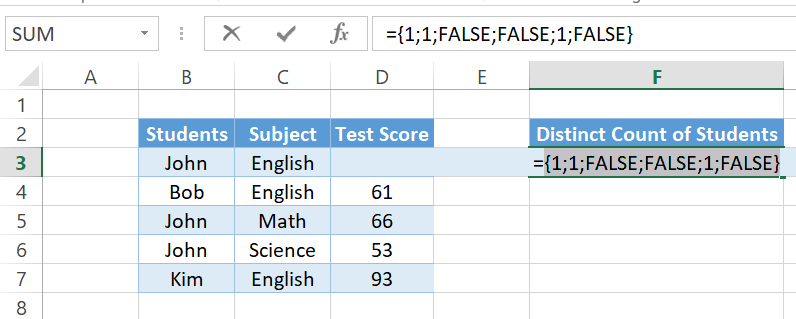
You see only the position of John, Bob, and Kim shows as one.
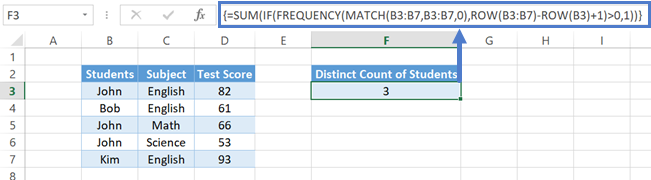
Lastly, add a SUM to sum up those ones. Since we want a single answer from the array this time, press CTRL + SHIFT + ENTER to confirm. It gives us a count of 3 distinct students.
FREQUENCY Function in Google Sheets
The FREQUENCY function works exactly the same in Google Sheets as in Excel 2019 and Office 365. You don’t have to press CTRL + SHIFT + ENTER or select a bunch of cells to spill to.
FREQUENCY Examples in VBA
You can also use the FREQUENCY function in VBA. Type:
application.worksheetfunction.frequency(data_array,bins_array)
