FORECAST Function – Examples in Excel, VBA, Google Sheets
Written by
Reviewed by
Download the example workbook
This tutorial demonstrates how to use the Excel FORECAST Function in Excel to count values that meet multiple criteria.
FORECAST Function Overview
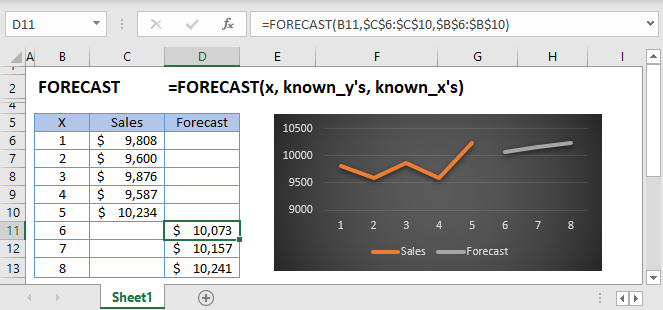
The FORECAST Function Uses a linear trend line to predict future Y-values.
To use the FORECAST Excel Worksheet Function, select a cell and type:
![]()
(Notice how the formula inputs appear)
FORECAST function Syntax and inputs:
=FORECAST(x,known_y's,known_x's)x – The x-value for which you want to forecast a new y-value
known_y’s – An Array of known y-values
known_x’s – An array of known x-values
What is FORECAST and FORECAST.LINEAR?
The FORECAST function in Excel is used to predict an x value given known x and y values. The function uses linear regression to determine the result.
Linear regression is a method in statistics used for predicting data following a straight line using known data. Regression is used to predict values such as sales growth, inventory requirements or simple market trends.
The FORECAST function exists for compatibility in Excel 2013 and earlier while FORECAST.LINEAR should be used in versions following Excel 2013. This article will use FORECAST.LINEAR for its examples but the syntax is identical for both functions.
Suppose I have a table of data with x and y values:
I want to know what the value of y is when the value of x = 20, where x is the independent variable and y is the dependent variable. Using FORECAST.LINEAR:
=FORECAST.LINEAR(20,B3:B7,C3:C7)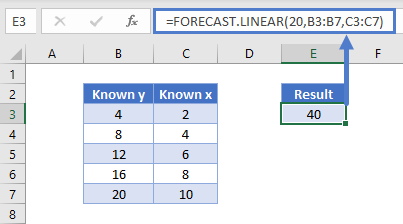
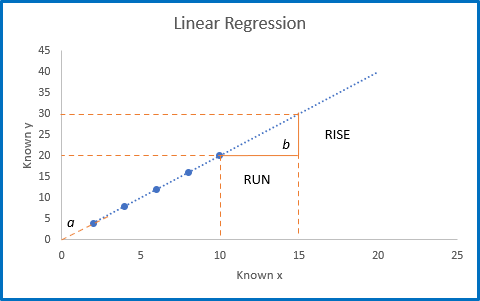
FORECAST.LINEAR shows the result as 40. Let us visualize on a graph:
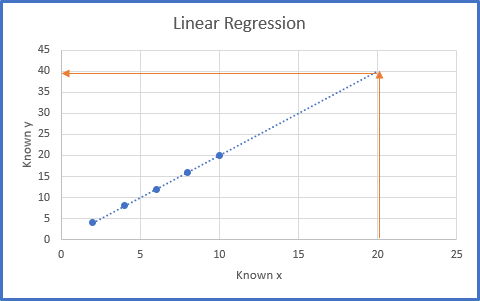
You can see that by plotting the data on a scatter chart and extending the line which best fits those data forward, the value of y when x = 20 is 40. Linear regression is sometimes also called the line of best fit. This matches the result of our function above.
How to use FORECAST.LINEAR
The FORECAST.LINEAR function takes three arguments:
=FORECAST.LINEAR(x, known_y’s, known_x’s)Where x is the data point you wish to predict a value for and known_y’s and known_x’s refer to the x and y data in your data table.
Using our first example, the function is written as:
=FORECAST.LINEAR(20,B3:B7,C3:C7)For the Math Lovers
The formula FORECAST.LINEAR generates the equation of the line in the form y= a+ bx where,
a is the y-intercept and b is the slope of the line.
Using the above chart, we can calculate the slope, b using the rise of the line divided by the run of the line Rise/Run and extending the trendline on the chart backward until is crosses the y-axis to find the y-intercept, a.
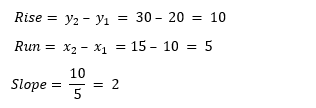
The y-intercept crosses the y-axis at y=0 , therefore a=0 .
The equation of this line is described as y= 0 + 2x or y = 2x.
Using Excel’s trendline option, we can show the equation of the line:
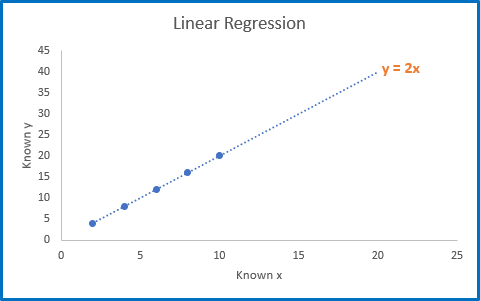
We can then check our forecast using the equation of the line.
y = 2x
Therefore, when x=20, y=2 x 20 = 40.
Interested in More Forecasting?
See our other articles on Forecasting with Exponential Smoothing, TREND and LINEST functions.
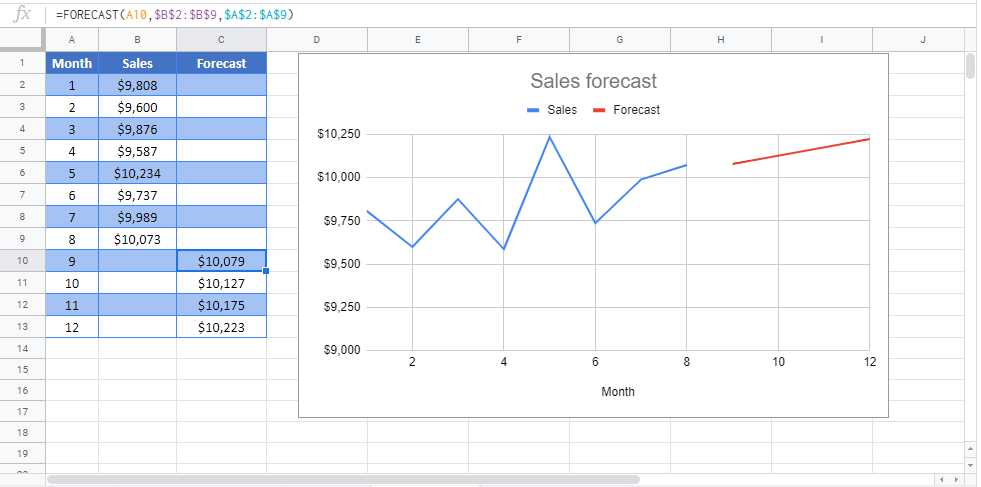
FORECAST function in Google Sheets
The FORECAST function works exactly the same in Google Sheets as in Excel.
FORECAST Examples in VBA

You can also use the FORECAST function in VBA. Type:
Application.Worksheetfunction.Forecast(x,known_y's,known_x's)For the function arguments (x, etc.), you can either enter them directly into the function, or define variables to use instead.
Return to the List of all Functions in Excel

